Plant monitoring with Raspberry Pi
Introduction
My partner has accumulated quite a collection of houseplants. Each has different watering needs, some like it dry, some need constant moisture, and remembering which is which became a challenge. After one too many wilted leaves, I decided to build something to help.
The result is RPi Gardener (be656d4), a plant monitoring system built around a Raspberry Pi 4. It tracks temperature, humidity, and soil moisture for multiple plants, displays readings on a web dashboard, and sends notifications when something needs attention.
This post walks through the design decisions, hardware choices, and software architecture. The goal was to build something practical, extensible, and fun to hack on.
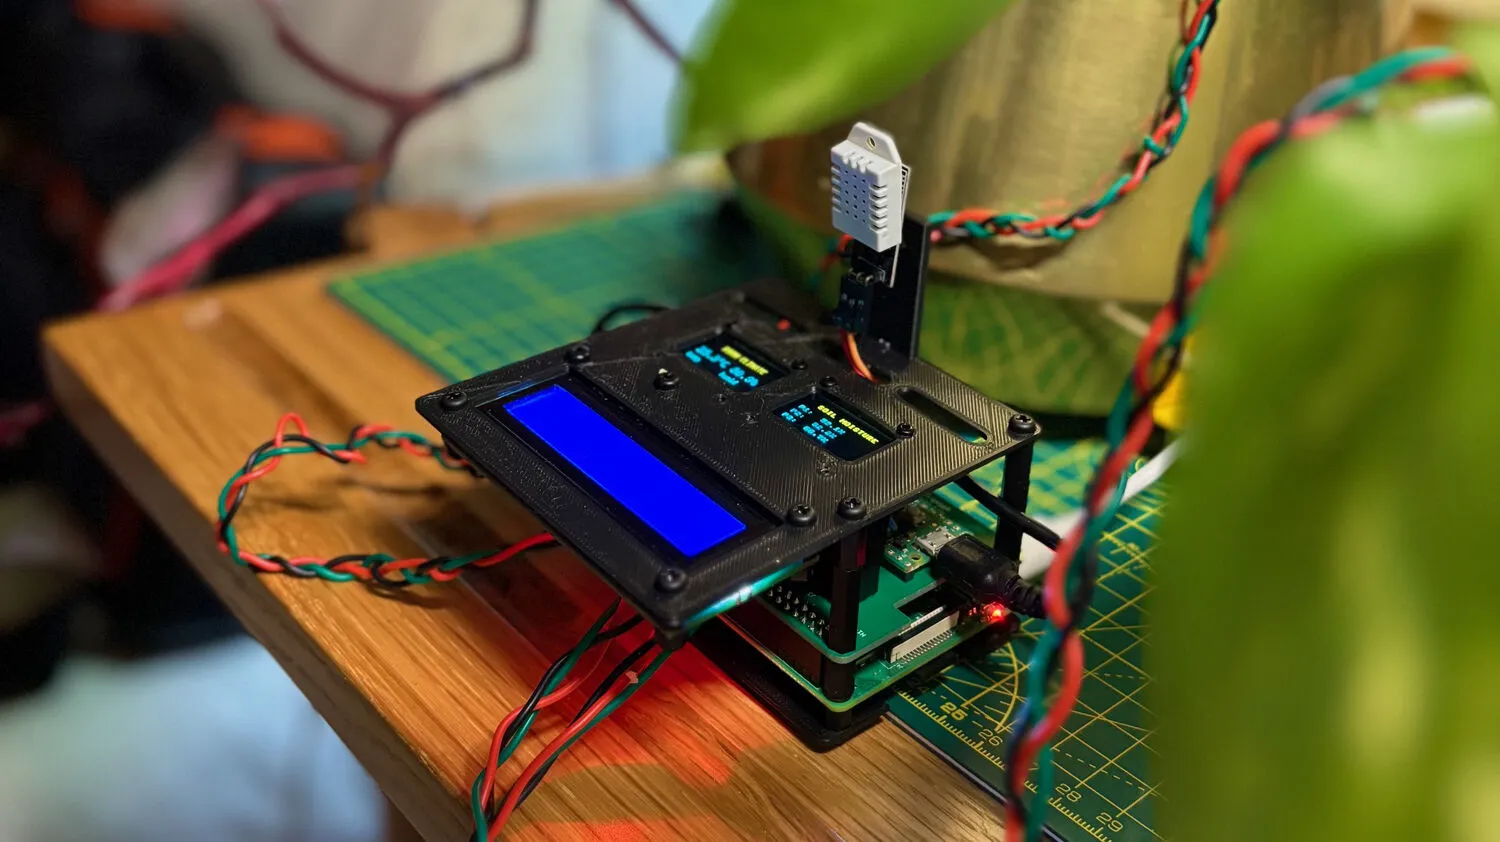
I. Why build from scratch?
Commercial plant monitors exist, but they tend to share similar limitations: proprietary apps, cloud dependencies, limited sensor options, and no way to integrate with other home systems. Most importantly, they’re less fun to tinker with.
There are also open source options like the Pimoroni Enviro Grow, which is a great piece of hardware and would have been the faster route. But building from scratch was really about learning, understanding each piece of the stack rather than using an off-the-shelf solution.
The other advantage is flexibility. Running on a full RPi means I can host a proper dashboard, set up alerting (email, Slack, etc.), and integrate with other systems like smart plugs. It becomes a hub rather than just a sensor. Plus there’s plenty of GPIO left on both the Pico and the RPi, so lots of room to expand later.
Building from scratch gives complete control:
- Local-first, no cloud accounts, no subscriptions, no privacy concerns
- Extensible, add sensors, displays, or automation as needed
- Hackable, the code is simple Python, easy to modify
- Educational, a great way to learn about hardware, async programming, and system design
The project also serves as a foundation for future expansion. A Pico W could report over WiFi from a greenhouse. A relay could automate watering. The architecture supports these additions without major rewrites.
II. Hardware overview
The system uses two microcontrollers working together:
- Raspberry Pi 4, the central hub running Docker containers
- Raspberry Pi Pico, dedicated to reading soil moisture sensors
a) Why both a Pico and a Raspberry Pi?
The Raspberry Pi 4 lacks analog-to-digital converter (ADC) inputs, which are required to read capacitive soil moisture sensors. A common solution is to add an external ADC module (like the ADS1115) to the RPi’s I2C bus. However, I already had a Pico lying around from a previous project, so why not put it to use? Turns out it offers several advantages over an external ADC:
- More GPIO, the Pico provides 3 ADC pins and 26 GPIO pins total, leaving room for additional sensors without competing for the RPi’s limited GPIO
- Architectural separation, keeping sensor reading on a dedicated microcontroller isolates it from the main application. If the RPi crashes, the Pico keeps running
- Network scalability, using a Pico W instead allows sensors to communicate over WiFi, enabling a distributed setup where multiple Picos in different locations report back to a single RPi
b) Sensors and displays
Sensors:
- DHT22, temperature (-40 to 80C) and humidity (0-100%) on GPIO17
- 3x Capacitive soil moisture sensors (v1.2), connected to Pico ADC pins 26, 27, 28
Displays:
- SSD1306 OLED 128x64, shows current readings on the RPi
- 1602A LCD 16x2, displays scrolling active alerts
- SSD1306 on Pico, shows soil moisture percentages
Optional automation:
- TP-Link Kasa smart plug, triggers based on sensor thresholds, can control any device. I use it to automatically turn on a humidifier when humidity drops too low
c) Custom PCB HAT
Early prototypes used breadboard wiring, which worked but was fragile. Cables came loose, connections were noisy, and the whole thing looked like a mess of spaghetti.
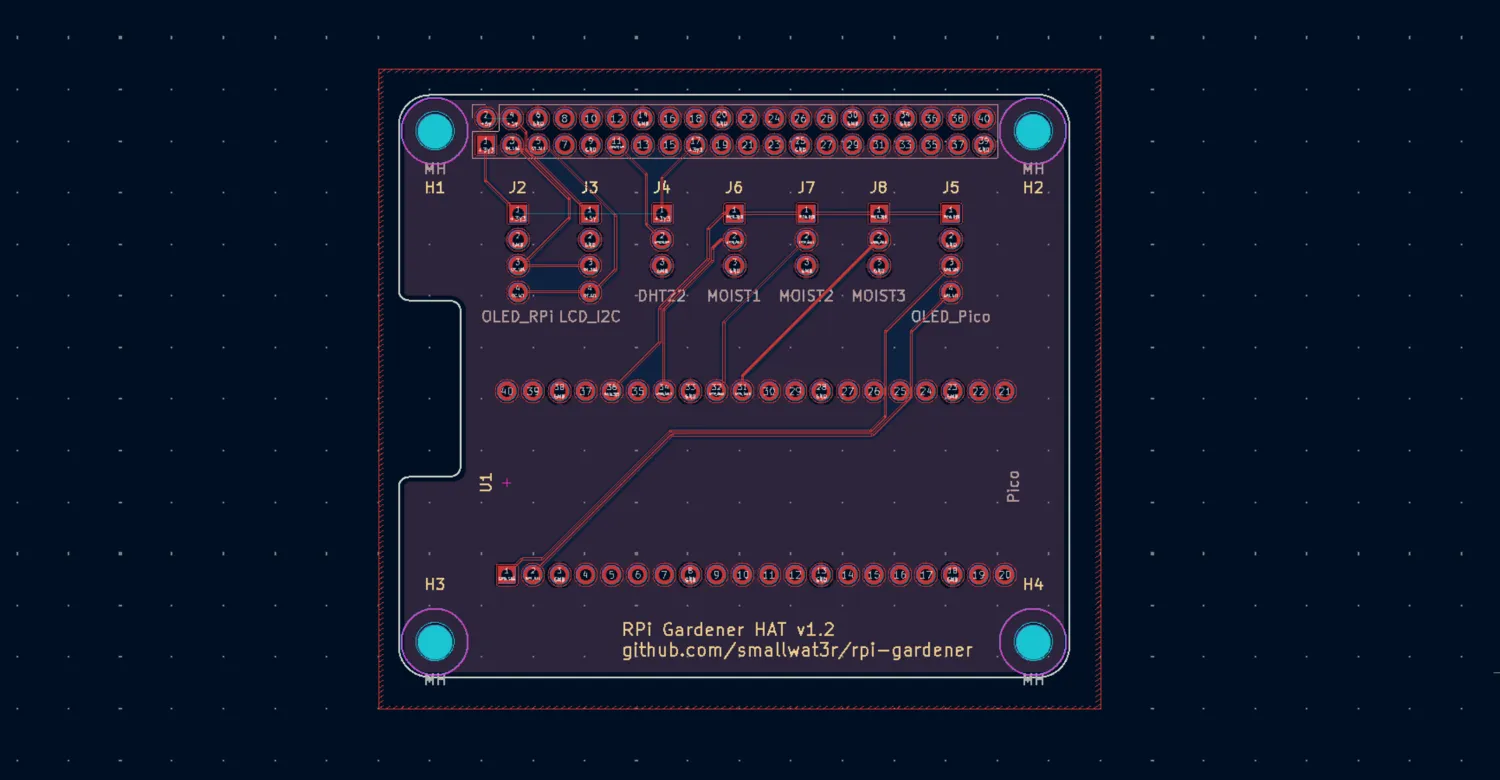
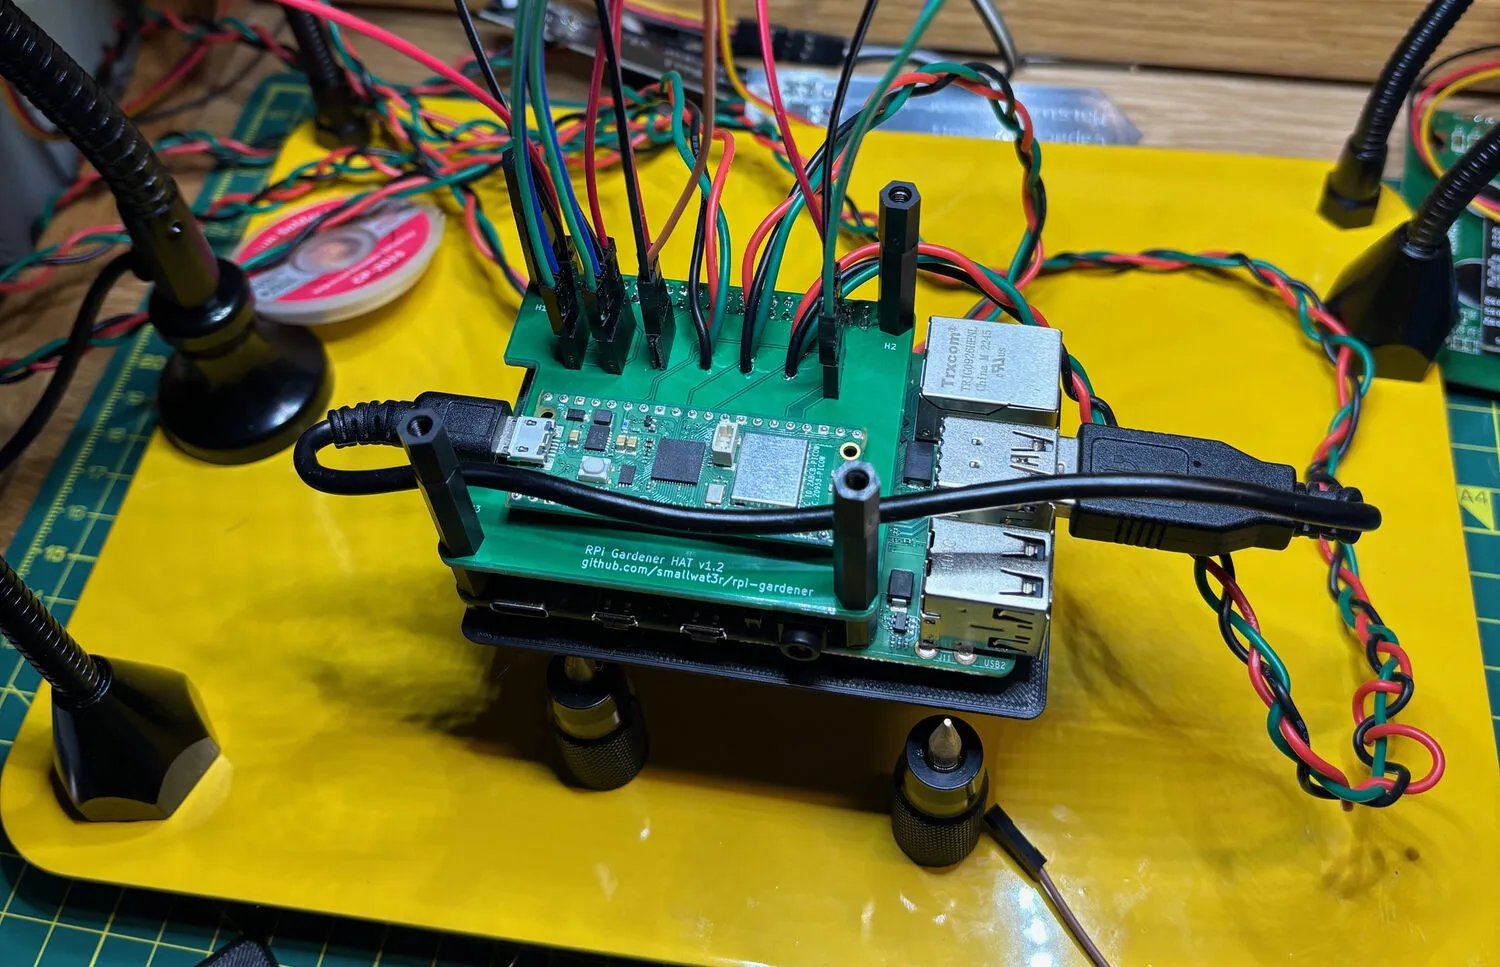
The solution is a custom PCB that mounts as a standard Raspberry Pi HAT (Hardware Attached on Top). It’s a 2-layer board (65mm x 56mm) that integrates:
- A slot for the Raspberry Pi Pico
- Connectors for all sensors (DHT22, three moisture sensors)
- Connectors for all displays (two OLEDs, one LCD)
- Pass-through for the RPi’s GPIO header
The Pico sits directly on the HAT and connects to the RPi via USB for serial communication. Its USB port remains accessible at the board edge for firmware updates.
Two separate I2C buses keep things organized: the RPi’s bus (GPIO2/GPIO3) handles the main OLED and LCD, while the Pico’s bus (GP0/GP1) drives its own OLED. This avoids address conflicts and keeps the microcontrollers independent.
The repository includes KiCad source files and manufacturing Gerbers.
Upload gerber.zip to JLCPCB or PCBWay and you’ll have
boards in a week for a few pounds.
d) 3D-printed case
A matching case holds everything together. The base plate (90mm x 62mm) has ventilation slots and a cable cutout. The display plate (90mm x 100mm) mounts both OLEDs and the LCD with proper cutouts, plus a tab for the DHT22 sensor.
OpenSCAD source files are included, so dimensions can be adjusted if you’re using different display sizes or want to modify the layout. STL files are pre-generated for direct printing.
The full assembly stacks: base plate, RPi 4, HAT with Pico, spacers, display plate. M3 hardware holds it together. The result is a compact, self-contained unit that can sit on a shelf near the plants.
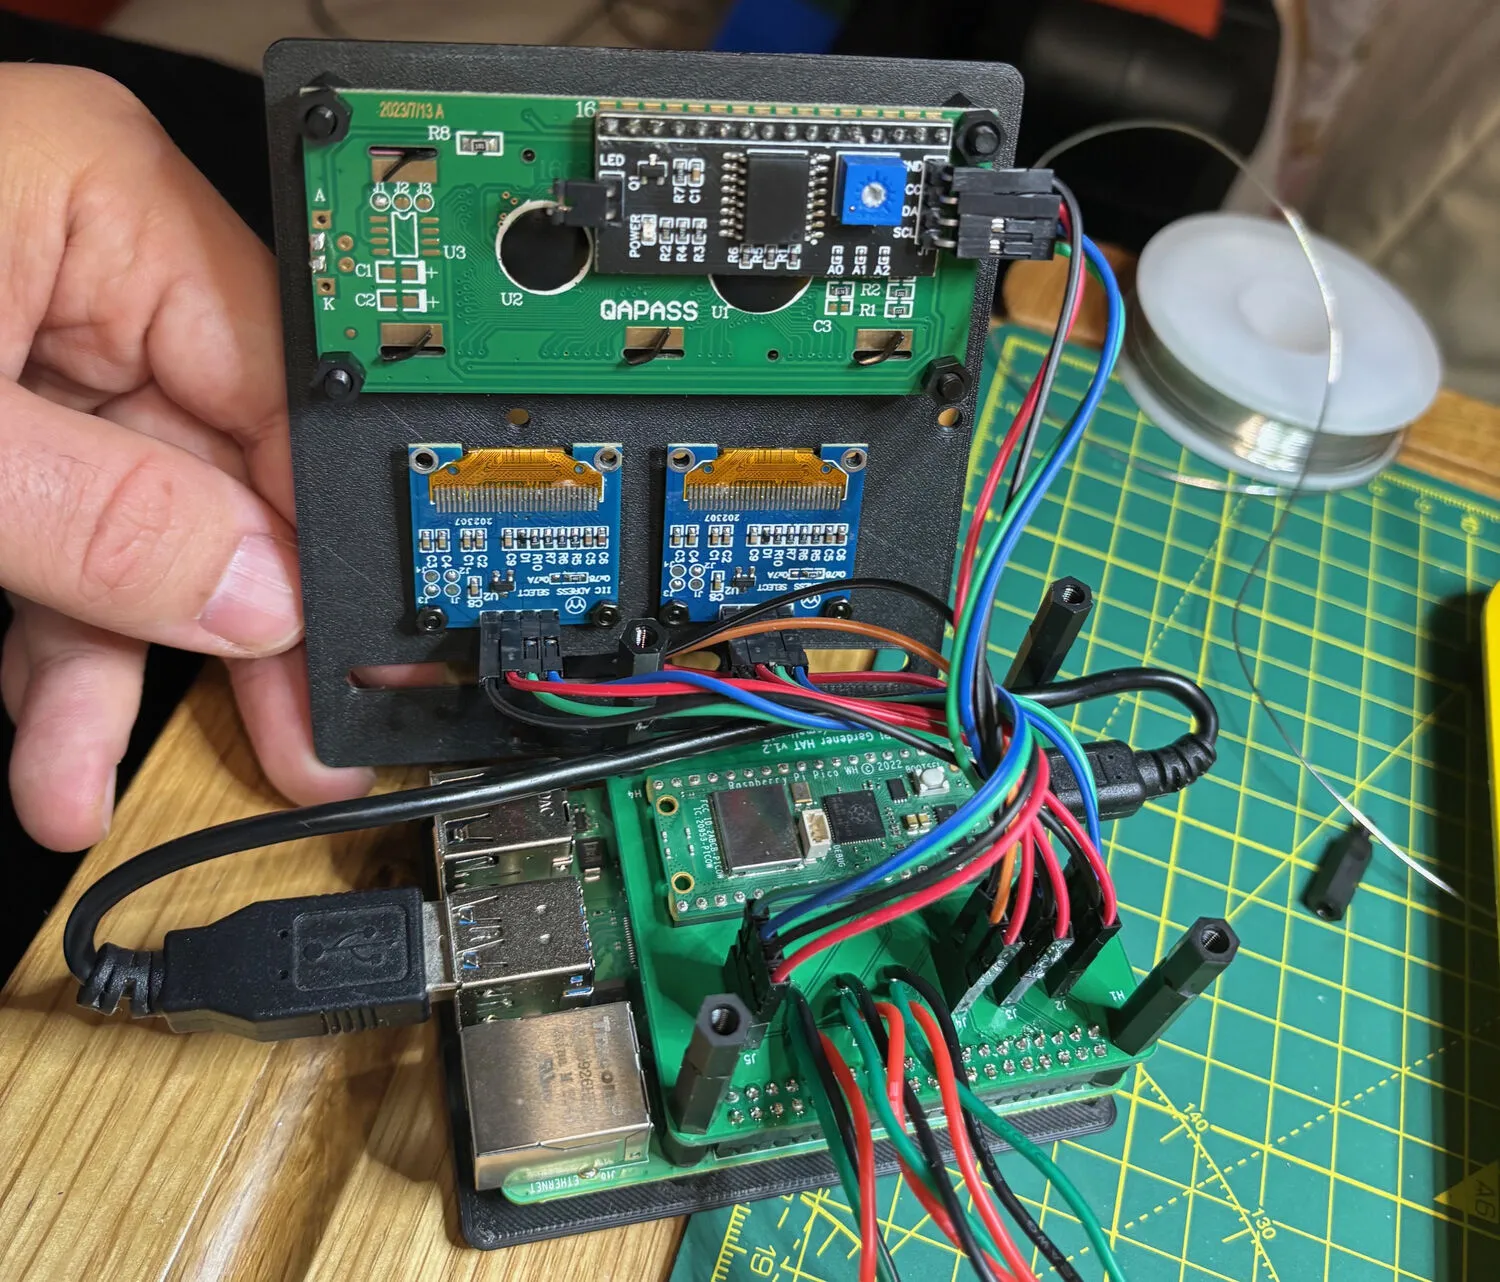
Alternatively, the system works fine with manual breadboard wiring. The PCB just makes it cleaner and more reliable for long-term use.
III. Software architecture
The software follows a microservices pattern, with multiple processes coordinated by supervisord inside a single Docker container.
Eight services run concurrently: two polling services (one for the DHT22 sensor, one for Pico serial), the Starlette web server, a notification dispatcher, a smart plug controller, two display renderers (OLED and LCD), and a cron job for database cleanup.
These services communicate through Redis pub/sub rather than direct calls. When the
DHT22 polling service reads a new temperature, it publishes a
dht.reading event. The web server subscribes to this topic
and streams it to connected browsers via SSE (Server-Sent Events). The notification service
subscribes to the alert topic and sends emails when
thresholds are crossed. The smart plug controller listens for humidity
alerts and toggles the plug accordingly.
This event-driven architecture keeps services decoupled. Each can be enabled or disabled via environment variables without affecting others. If notifications aren’t needed, that service simply doesn’t start. If there’s no LCD connected, the LCD service exits cleanly at startup.
Persistent data lives in SQLite, sensor readings, settings, and admin credentials. The database uses WAL mode for concurrent reads during polling and web requests.
a) The polling service pattern
All sensor polling services share a common abstraction that implements the poll-audit-persist pattern:
class PollingService[T](ABC):
    """Abstract base class for async sensor polling services."""

    @abstractmethod
    async def poll(self) -> T | None:
        """Poll the sensor for a new reading."""

    @abstractmethod
    async def audit(self, reading: T) -> bool:
        """Audit the reading against thresholds."""

    @abstractmethod
    async def persist(self, reading: T) -> None:
        """Persist the reading to the database."""

    async def _poll_cycle(self) -> None:
        """Execute a single poll -> audit -> persist cycle."""
        reading = await self.poll()
        if reading is not None:
            if await self.audit(reading):
                await self.persist(reading)

    async def _run_loop(self) -> None:
        """Run the async polling loop with precise timing."""
        await self.initialize()
        loop = asyncio.get_running_loop()

        while not self._shutdown_requested:
            cycle_start = loop.time()
            try:
                await self._poll_cycle()
            except Exception as e:
                self.on_poll_error(e)

            # Sleep only the remaining time to maintain consistent intervals
            elapsed = loop.time() - cycle_start
            sleep_time = max(0, self.frequency_sec - elapsed)
            if sleep_time > 0:
await asyncio.sleep(sleep_time)This abstraction handles signal handlers for graceful shutdown, error recovery, and precise timing. The DHT22 and Pico services both inherit from it, implementing only the sensor-specific logic.
b) Event bus with Redis
Services communicate through a Redis pub/sub event bus. This enables real-time updates to the web dashboard and loose coupling between components:
class Topic(StrEnum):
    """Event bus topics for pub/sub channels."""
    DHT_READING = "dht.reading"
    PICO_READING = "pico.reading"
    ALERT = "alert"
    HUMIDIFIER_STATE = "humidifier.state"


@dataclass(frozen=True, slots=True)
class DHTReadingEvent(_Event):
    """DHT sensor reading event."""
    temperature: float
    humidity: float
    recording_time: datetime

    @property
    def topic(self) -> Topic:
        return Topic.DHT_READING

    def to_dict(self) -> dict[str, Any]:
        return {
            "type": self.topic,
            "temperature": self.temperature,
            "humidity": self.humidity,
            "recording_time": self.recording_time.strftime("%Y-%m-%d %H:%M:%S"),
            "epoch": int(self.recording_time.timestamp() * 1000),
}The EventPublisher is synchronous (used by polling
services), while EventSubscriber is async (used by the web
server). Both include automatic reconnection with exponential backoff to
handle Redis restarts gracefully.
IV. Database design
SQLite is the database. For a plant monitoring system writing a few readings every two seconds, it’s more than sufficient. No need for PostgreSQL or MySQL, SQLite runs in-process, requires zero configuration, and the entire database is a single file that’s easy to backup or inspect.
a) Schema
The schema is minimal. Two tables for sensor readings, one for settings, one for admin credentials:
CREATE TABLE reading(
    id INTEGER PRIMARY KEY,
    temperature REAL NOT NULL,
    humidity REAL NOT NULL,
    recording_time INTEGER NOT NULL
);

CREATE TABLE pico_reading(
    id INTEGER PRIMARY KEY,
    plant_id INTEGER NOT NULL,
    moisture REAL NOT NULL,
    recording_time INTEGER NOT NULL
);

CREATE TABLE settings (
    key TEXT PRIMARY KEY,
    value TEXT NOT NULL,
    updated_at TEXT NOT NULL DEFAULT (datetime('now'))
);

CREATE TABLE admin (
    id INTEGER PRIMARY KEY CHECK (id = 1),  -- single row constraint
    password_hash TEXT NOT NULL,
    updated_at TEXT NOT NULL DEFAULT (datetime('now'))
);Timestamps in sensor tables are stored as Unix epochs (integers)
rather than ISO strings. This makes range queries faster and sorting
trivial. The admin table uses a CHECK constraint to enforce
a single row, storing the argon2 hash of the admin password.
b) Indexes for time-series queries
The dashboard needs to query readings within a time range and aggregate them into chart buckets. Without indexes, these queries would scan the entire table.
CREATE INDEX reading_idx ON reading(recording_time DESC);
CREATE INDEX reading_cover_idx ON reading(recording_time, temperature, humidity);The first index speeds up range scans. The second is a covering index, it includes all columns needed by chart queries, so SQLite can answer entirely from the index without touching the table.
c) WAL mode and connection patterns
SQLite’s default journal mode blocks readers during writes. WAL (Write-Ahead Logging) mode allows readers and a writer to work concurrently, readers don’t block the writer and the writer doesn’t block readers. This matters when the polling service is inserting while the web server is querying:
await db.execute_pragma("PRAGMA journal_mode=WAL")
await db.execute_pragma("PRAGMA auto_vacuum=INCREMENTAL")Two connection patterns handle different access patterns:
- Persistent connection for polling services, a single long-lived connection avoids overhead on frequent 2-second polling loops
- Connection pool for the web server, connections are reused across requests with bounded concurrency (default 5)
The choice is automatic. If init_db() was called at
startup (polling services), subsequent calls use the persistent
connection. Otherwise (web server), they draw from the pool.
d) Time-bucketed aggregation
Displaying a week of data at 2-second intervals would mean 300,000+ points per sensor, far too many for a chart. The dashboard aggregates readings into time buckets:
SELECT ROUND(AVG(temperature), 1) as temperature,
       ROUND(AVG(humidity), 1) as humidity,
       (recording_time / :bucket * :bucket) * 1000 as epoch
FROM reading
WHERE recording_time >= :from_epoch
GROUP BY recording_time / :bucket
ORDER BY epoch DESCInteger division (recording_time / :bucket * :bucket)
floors timestamps to bucket boundaries. The bucket size is calculated to
produce roughly 500 data points regardless of the time range, keeping
charts responsive.
e) Data retention
A cron job runs daily to delete readings older than the configured retention period (default 7 days). This keeps the database size bounded and queries fast. The admin UI allows adjusting retention from 1 to 365 days.
V. The Pico firmware
The Pico runs MicroPython and handles soil moisture sensing. It reads three capacitive sensors, converts ADC values to percentages, displays them on an OLED, and sends JSON over USB serial:
class Calibration:
    def __init__(self, cmin, cmax):
        self.min = cmin
        self.max = cmax

    @property
    def diff(self):
        return self.max - self.min


# Calibration varies by sensor, tuned independently
plants = (
    Plant("plant-1", ADC(Pin(26)), Calibration(15600, 43500)),
    Plant("plant-2", ADC(Pin(27)), Calibration(15600, 43500)),
    Plant("plant-3", ADC(Pin(28)), Calibration(14500, 44000)),
)


def read_moisture(plant):
    """Read moisture level from a plant sensor, clamped to 0-100%."""
    raw = plant.pin.read_u16()
    pct = round((plant.cal.max - raw) * 100 / plant.cal.diff, 2)
    return {"pct": max(0, min(100, pct)), "raw": raw}


def main():
    """Main loop for reading sensors and sending data via USB serial."""
    display = init_display()
    wdt = WDT(timeout=8000)
    readings = {plant.name: {"pct": 0, "raw": 0} for plant in plants}

    while True:
        for plant in plants:
            readings[plant.name] = read_moisture(plant)

        update_display(display, readings)
        print(ujson.dumps(readings))  # Send JSON over USB serial

        utime.sleep(POLLING_INTERVAL_SEC)
        gc.collect()
wdt.feed()The calibration values (min/max ADC readings) were determined experimentally by measuring each sensor in completely dry soil and fully saturated soil. Each sensor needed slightly different calibration, which is why they’re configured individually.
The watchdog timer (WDT) resets the Pico if the main
loop hangs for more than 8 seconds, a simple reliability mechanism for
unattended operation.
VI. Alert system with hysteresis
A naive alert system would spam notifications when values oscillate around thresholds. If humidity is at 39.9% with a 40% threshold, small fluctuations would trigger endless alerts.
The solution is hysteresis with a confirmation window:
@dataclass(frozen=True, slots=True)
class _ThresholdCheck:
    """Parameters for a threshold check."""
    namespace: Namespace
    sensor_name: _SensorName
    value: float
    threshold: float
    threshold_type: ThresholdType
    hysteresis: float

    def is_violated(self) -> bool:
        """Check if the threshold is currently violated."""
        if self.threshold_type == ThresholdType.MIN:
            return self.value < self.threshold
        return self.value > self.threshold

    def has_recovered(self) -> bool:
        """Check if value has recovered past the hysteresis band."""
        if self.threshold_type == ThresholdType.MIN:
            return self.value >= self.threshold + self.hysteresis
return self.value <= self.threshold - self.hysteresisThe AlertTracker requires multiple consecutive readings
in a new state before transitioning:
class _ConfirmationTracker:
    """Requires N consecutive readings before confirming state change."""

    def __init__(self, confirmation_count: int) -> None:
        self._confirmation_count = confirmation_count
        self._pending_counts: dict[_AlertKey, int] = {}

    def should_confirm(self, key: _AlertKey, wants_transition: bool) -> bool:
        if not wants_transition:
            self._pending_counts.pop(key, None)
            return False

        pending = self._pending_counts.get(key, 0) + 1
        self._pending_counts[key] = pending

        if pending >= self._confirmation_count:
            self._pending_counts.pop(key, None)
            return True
return FalseWith default settings, an alert triggers when:
- Value crosses the threshold
- Three consecutive readings confirm the violation
- The alert state transitions from OK to IN_ALERT
Recovery requires the value to pass the threshold plus hysteresis (e.g., if humidity threshold is 40% with 3% hysteresis, it must reach 43% to clear).
Callbacks are invoked only on state transitions, not on every reading. This prevents notification spam while still being responsive to actual problems.
VII. Spike rejection for moisture sensors
Capacitive moisture sensors can malfunction, returning 100% when there’s a connection issue or the sensor is damaged. The Pico reader includes spike rejection:
def _is_spike(self, plant_id: int, moisture: float) -> bool:
    """Detect sudden jumps to 100% that indicate sensor errors.

    Returns True if the reading jumps to 100% by more than the configured
    spike threshold. First readings are never spikes.
    """
    if plant_id not in self._last_readings:
        return False
    if moisture < 100.0:
        return False
    delta = moisture - self._last_readings[plant_id]
return delta > self._spike_thresholdOnly spikes toward 100% are rejected. Legitimate increases after watering (which can be sudden) are allowed. Anomalous readings are marked but still logged for debugging, and the baseline isn’t updated with spike values.
VIII. Real-time web dashboard
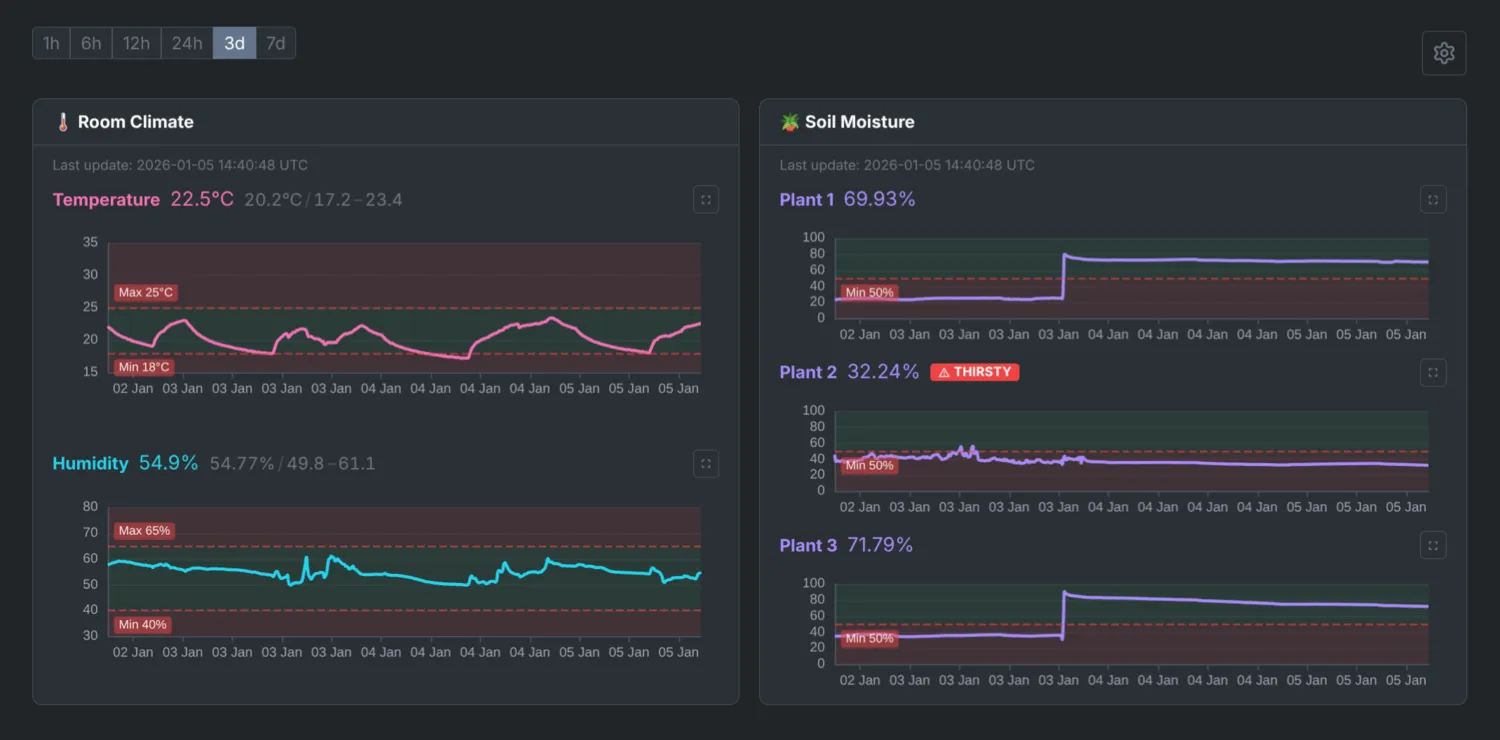
The frontend is a Preact SPA with TypeScript, using SSE for real-time updates. SSE was chosen over WebSockets because the data flow is one-way: the server pushes readings to the browser, but the browser never needs to send data back. SSE is simpler to implement, works over standard HTTP, and handles reconnection automatically. The backend streams events from Redis:
async def _subscribe_to_topic(topic: Topic) -> AsyncIterator[dict[str, Any]]:
    """Subscribe to a Redis topic and yield events as they arrive."""
    client = aioredis.from_url(redis_url)
    pubsub = client.pubsub()
    await pubsub.subscribe(str(topic))

    async for message in pubsub.listen():
        if message["type"] != "message":
            continue
        data = json.loads(message["data"].decode())
        yield data


async def _event_generator(
    request: Request,
    topic: Topic,
    initial_data: Any = None,
) -> AsyncIterator[str]:
    """Generate SSE events for a client."""
    if initial_data is not None:
        yield f"data: {json.dumps(initial_data)}\n\n"

    async for data in _subscribe_to_topic(topic):
        if await request.is_disconnected():
            break
yield f"data: {json.dumps(data)}\n\n"On connection, clients receive the latest reading immediately, then stream updates as they arrive. The dashboard shows live charts using ECharts, with time-range filters (1h, 6h, 24h, 7d) and min/max/avg statistics.
An admin interface (behind HTTP Basic Auth) allows adjusting thresholds, notification settings, and data retention without restarting services.
IX. Notification system
Notifications support multiple backends (Gmail, Slack) with pluggable architecture:
class AbstractNotifier(ABC):
    """Abstract base class for notification backends."""

    @abstractmethod
    async def send(self, event: AlertEvent) -> None:
        """Send a notification for the given alert event."""


class CompositeNotifier(AbstractNotifier):
    """Sends notifications to multiple backends."""

    def __init__(self, notifiers: list[AbstractNotifier]):
        self._notifiers = notifiers

    async def send(self, event: AlertEvent) -> None:
        """Send notification to all configured backends concurrently."""
        results = await asyncio.gather(
            *(notifier.send(event) for notifier in self._notifiers),
            return_exceptions=True,
        )
# Handle partial failures...Each backend includes retry logic with exponential backoff. Gmail uses SMTP with TLS, Slack uses webhooks with formatted block messages. Both send HTML and plain-text versions.
Notifications are fetched fresh for each alert, so admin UI changes take effect immediately without service restarts.
X. Docker deployment
The application runs in a single Docker container managed by supervisord:
[program:polling]
command=python -m rpi.dht
directory=/app
user=appuser
autostart=true
autorestart=true
startretries=3

[program:pico]
command=python -m rpi.pico
directory=/app
user=appuser
autostart=true
autorestart=true
startretries=3

[program:uvicorn]
command=uvicorn rpi.server.entrypoint:create_app --factory --uds /tmp/uvicorn.sock
directory=/app
user=appuser
autostart=true
autorestart=true

# ...All processes run as a non-root appuser (except cron,
which needs root). Logs go to stdout/stderr for Docker’s log management.
Services restart automatically on failure with a 3-retry limit.
The compose stack includes:
- nginx, reverse proxy with SSL termination (self-signed certs)
- redis, event bus for pub/sub
- app, the main application container
Volumes persist the SQLite database and SSL certificates across restarts.
XI. Configuration
a) Environment variables
All settings are environment variables validated by Pydantic at startup:
# Thresholds
MAX_TEMPERATURE=25
MIN_TEMPERATURE=18
MAX_HUMIDITY=65
MIN_HUMIDITY=40
MIN_MOISTURE=30
MIN_MOISTURE_PLANT_1=25  # per-plant overrides

# Notifications
ENABLE_NOTIFICATION_SERVICE=1
NOTIFICATION_BACKENDS=gmail,slack
GMAIL_SENDER=alerts@example.com
GMAIL_RECIPIENTS=you@example.com
SLACK_WEBHOOK_URL=https://hooks.slack.com/...

# Optional features
ENABLE_HUMIDIFIER=0
ENABLE_OLED=0
ENABLE_LCD=0

# Data retention
RETENTION_DAYS=7

# ...Services check their enable flags at startup and exit cleanly if disabled. The admin UI can override thresholds and notification settings without container restarts.
b) Mock sensors for development
Running the full stack without hardware is useful for development and
testing. Setting MOCK_SENSORS=1 replaces real sensor reads
with simulated data:
def _create_sensor() -> DHTSensor:
    """Create sensor based on configuration."""
    if get_settings().mock_sensors:
        from rpi.lib.mock import MockDHTSensor
        return MockDHTSensor()
    from adafruit_dht import DHT22
    from board import D17
return DHT22(D17)The mock DHT sensor generates sinusoidal temperature and humidity values. The mock Pico source produces random moisture readings. There are also mocks for displays, smart plugs, and other hardware components. This allows testing the full stack, dashboard, alerts, and notifications, on a laptop without any Pi hardware.
XII. Security considerations
This system is designed for local home networks, not the public internet.
- HTTPS with self-signed certificates, encrypts traffic on the local network
- Admin interface behind HTTP Basic Auth, threshold and notification settings require a password
- No cloud dependencies, all data stays on the local network
- Non-root processes, services run
as
appuserinside the container
For remote access, I use Tailscale to connect to my home network. The RPi appears as a node on my tailnet, accessible from anywhere without exposing ports to the public internet.
If exposing directly to the internet, additional hardening would be needed: proper TLS certificates, stronger authentication, rate limiting, and network segmentation. For a plant monitor behind Tailscale or on a local network, the current setup is reasonable.
XIII. Future plans
The current system handles basic monitoring well, but there’s room to grow:
- Pico W over WiFi, multiple Picos in different locations reporting to a single base station
- Automated watering, relay controls triggered by moisture thresholds
- Additional sensors, light levels, water reservoir levels
- Historical analysis, export data, trend reports, predictive alerts
The architecture supports these additions. The event bus can handle more publishers, the database schema is straightforward to extend, and the service pattern makes adding new components simple.
~~~
Wrapping up
Building this system was a fun blend of hardware and software challenges, and now I have happy plants, fewer forgotten waterings, a dashboard to show off, and a happy girlfriend.
Links
- RPi Gardener (be656d4), full source code and hardware files
- Raspberry Pi Documentation, official guides